Santa Clarita sits in a valley surrounded by the San Gabriel, Santa Susana, and Sierra Pelona mountains, creating a basin that traps airborne allergens. With a mild Mediterranean climate and dense chaparral ecosystem covering 72% of wildland areas, the city experiences year-round pollen activity with extended allergy seasons. This article covers the main pollen types, seasonal patterns, unique local factors, and strategies to manage allergies in Santa Clarita.
Understanding Pollen Count in Santa Clarita
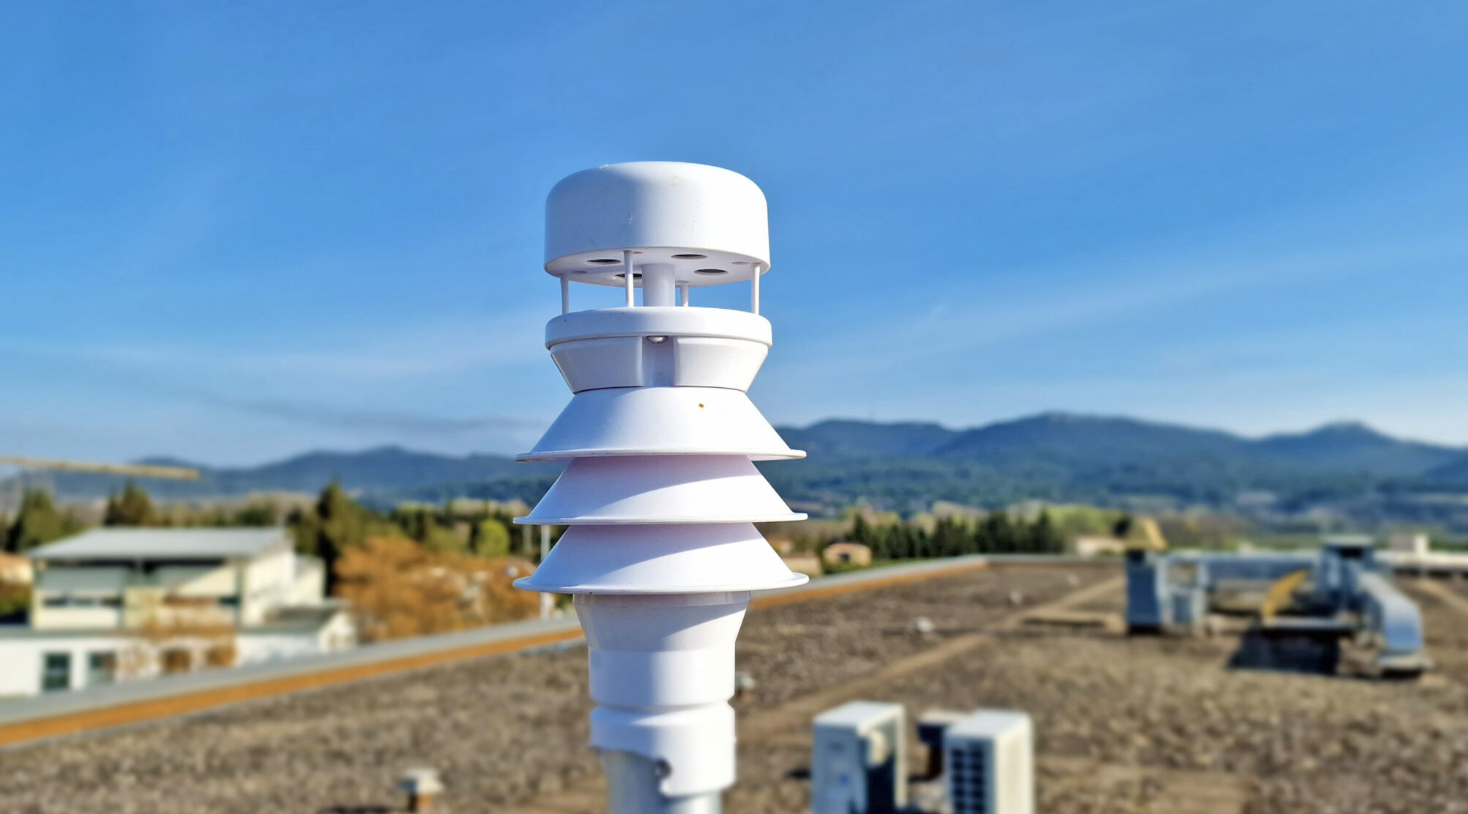
Pollen count measures the number of pollen grains per cubic meter of air, collected by automated particulate sensors that use neural network algorithms to identify individual species. When pollen counts are high, allergy sufferers commonly experience nasal congestion, sneezing, itchy and watery eyes, throat irritation, and difficulty breathing. Peak pollen times occur from dawn to mid-morning due to overnight accumulation and morning plant release.
Key Pollen Types and Recent Trends in Santa Clarita
Santa Clarita's allergen profile is dominated by California sagebrush, the most significant weed allergen native to the coastal sage scrub ecosystem, and oak species, particularly Coast Live Oak, which produces abundant pollen from February through April. Recent monitoring data from Pollen Sense automated sensors tracked monthly pollen levels from February 2022 through May 2023, revealing that March through May shows the most pronounced rise in pollen intensity.
- Oak Species Pollen: Coast Live Oak is the most significant tree allergen, producing peak pollen from February to April with overlapping pollination from sycamore, cottonwood, and willow creating the highest allergen burden
- California Sagebrush: The dominant shrub in chaparral ecosystems surrounding Santa Clarita, this weed produces peak pollen from August through October with extended activity into November due to mild climate
- Bermuda Grass: Reaches maximum pollen production during June and July peak grass season, widely planted in lawns and parks throughout the urbanized valley
- Juniper and Cypress: First trees to pollinate each year beginning in December through January, often before residents expect allergy season to start
The mild Mediterranean climate prevents killing frosts, allowing weed pollen to persist into late fall and tree pollen to begin earlier than most US cities. Santa Ana winds from September through May dramatically amplify pollen dispersal by stirring up settled allergens and carrying pollen from hundreds of miles away, causing sudden spikes in symptoms across the valley.
Seasonal Pollen Patterns in Santa Clarita
Santa Clarita experiences distinct seasonal pollen shifts with overlapping allergen sources throughout the year.
- Winter (December to February): Juniper and cypress begin early pollination in December, followed by cedar in January and early oak pollen appearing in February as catkins become visible
- Spring (March to May): The worst period for allergies with peak tree pollen from oak, sycamore, cottonwood, willow, ash, olive, and mulberry creating overlapping allergen burden, while grass pollen begins rising in late March
- Summer (June to August): Peak grass pollen season dominated by Bermuda grass, Kentucky bluegrass, and Timothy grass reaching maximum levels in June and July, with weed pollen season beginning in late August
- Fall (September to November): Peak weed pollen season from August through October featuring California sagebrush, ragweed, pigweed, Russian thistle, and saltbush, with persistence into November due to no killing frost
Access Daily Pollen Data in Santa Clarita
The Pollen Count & Alerts App provides real-time pollen monitoring specifically for Santa Clarita, tracking tree, grass, weed, and mold spore levels throughout the day. With data collected from automated particulate sensors using neural network technology, you receive accurate daily counts and forecasts to plan outdoor activities during low-pollen windows. Download the app to stay informed during Santa Clarita's extended allergy seasons.
Effective Allergy Management Strategies for Santa Clarita Residents
Managing allergies in Santa Clarita's year-round pollen environment requires proactive strategies and daily awareness.
- Use the Pollen Count & Alerts App: Monitor real-time pollen levels and receive alerts to plan outdoor activities during low-pollen times, especially avoiding dawn to mid-morning peak hours
- Maintain Indoor Air Quality: Keep windows closed during high pollen periods, particularly during Santa Ana wind events when allergens are stirred up and dispersed across the valley
- Practice Personal Hygiene: Shower and wash hair before bed to remove pollen collected throughout the day, and change clothes after spending time outdoors during peak seasons
- Install HEPA Air Purifiers: Use high-efficiency particulate air filters in bedrooms and main living areas to remove airborne pollen, especially during March through May peak tree season
- Consult an Allergist: Seek professional evaluation for personalized treatment plans, especially if experiencing asthma exacerbation or chronic symptoms during the extended allergy season
App Features to Enhance Your Allergy Management
The Pollen Count & Alerts App offers comprehensive tools designed specifically for tracking and managing pollen exposure in Santa Clarita.
- Real-Time Pollen Counts: Access the latest pollen data specific to Santa Clarita with species-level breakdowns for tree, grass, and weed allergens collected from automated sensors
- Customized Alerts: Receive personalized notifications when pollen levels rise for your specific allergens, including warnings during Santa Ana wind events
- Accurate Forecasts: View multi-day pollen predictions based on weather data and historical trends to plan ahead for outdoor activities and medication timing
- Educational Content: Learn about local allergen sources including California sagebrush, oak species, and chaparral ecosystem plants unique to the Santa Clarita Valley
- Intuitive Design: Navigate easily through daily counts, seasonal calendars, and allergen-specific information with a user-friendly interface designed for quick reference


Learn More About Managing Your Allergies
- Understanding Allergy Pollen Counts: Your Comprehensive Guide – Discover how to interpret pollen count data and develop effective strategies to minimize your exposure to seasonal allergens.
- Why Are My Allergies So Bad Right Now? | Pollen Count & Alerts App Blog – Understand the environmental and physiological factors that can cause your allergy symptoms to intensify unexpectedly.
- Do Allergies Get Worse as You Age? | Pollen Count & Alerts App Blog – Explore how your immune system's response to allergens evolves throughout different life stages and what you can do to adapt.
Stay updated with the latest tips and insights by visiting the Alert Pollen Blog.
FAQ
When is pollen season in Santa Clarita, CA?
Santa Clarita experiences pollen activity year-round due to its mild Mediterranean climate, but the worst period is spring from March through May when multiple tree species pollinate simultaneously, including oak, sycamore, and olive. Summer (June-August) brings peak grass pollen from Bermuda and Timothy grass, while fall (August-October) sees high weed pollen levels, particularly from California sagebrush and ragweed. The only relief window occurs November through January, though even these months can have elevated pollen counts.
What are the most common allergens in Santa Clarita, CA?
The most significant tree allergen is Coast Live Oak (Quercus agrifolia), which produces abundant pollen from February to April, along with juniper, cypress, and cedar that begin as early as December. For grasses, Bermuda grass and Kentucky bluegrass peak in June and July. California sagebrush (Artemisia californica) is the dominant weed allergen, peaking August through October alongside ragweed, pigweed, and Russian thistle. The surrounding chaparral ecosystem, which covers 72% of wildland areas, also contributes unique allergens from chamise, manzanita, and California buckwheat.
How can I protect myself from Santa Clarita's high pollen levels during Santa Ana wind events?
During Santa Ana winds (September-May), stay indoors during dawn to mid-morning when pollen levels peak, keep windows and doors closed, and use HEPA air filters to reduce indoor allergen exposure. The Pollen Count & Alerts App provides real-time alerts for sudden pollen spikes, allowing you to plan outdoor activities during lower-risk periods. If you must go outside, wear wraparound sunglasses and change clothes immediately upon returning indoors to minimize allergen transfer.
Final Thoughts
Living in Santa Clarita means facing year-round pollen challenges, from spring's intense oak pollen to fall's persistent sagebrush allergens, all amplified by the valley's unique basin geography and Santa Ana winds. However, with accurate information about local pollen patterns and the right tools, you can take control of your allergy symptoms. The Pollen Count & Alerts App empowers you to anticipate high-pollen days and adjust your activities accordingly.
Don't let Santa Clarita's pollen keep you from enjoying the outdoors. Download the Pollen Count & Alerts App today to receive personalized alerts and stay one step ahead of allergens.
Take Control of Your Allergies Today
The Pollen Count & Alerts App provides real-time pollen counts specific to Santa Clarita, personalized alerts based on your allergen sensitivities, and comprehensive 5-day forecasts so you can plan your week with confidence. Whether you're dealing with oak pollen in spring, grass allergies in summer, or sagebrush in fall, our app gives you the information you need to breathe easier. Download now and experience fewer allergy symptoms with science-backed, location-specific data.